Talk to a Ram 3500 Sales Tech
1-888-706-1096
M-F 8:30A-11P, Sat-Sun 8:30A-9P

Driving Decisions: Gas Prices and American Travel in 2024

AT Staff
By: 

AT Staff

 / Jun 3 2024
Driving Decisions: Gas Prices and American Travel in 2024

Driving Decisions: Gas Prices and American Travel in 2024

How much of Americans’ income goes into their gas tanks? With gas prices continually fluctuating, we wanted to find out—so we surveyed over 1,000 Americans about how much they allocate to gas, their opinions on gas prices, and how current prices impact their summer travel plans. We also uncovered regional differences in gas prices across the U.S. and how various demographics choose where to fill up. This article offers an overview of how gas prices will shape American lives and travel decisions in 2024.

Key Takeaways

  • The average price of a gallon of gas in the U.S. is $3.58; California has the highest average price ($5.10) and Mississippi has the lowest ($3.03).
  • On average, Americans spend $1,712 annually ($143 monthly) on gas; this represents roughly 3% of their annual income.
  • On average, Americans believe that a gallon of gas should cost $2.37 per gallon, roughly 37% less than what they are currently paying.
  • 23% of Americans are holding back on summer travel and/or road trips due to gas prices.

State-by-State Breakdown of Gas Prices

  • The average price of a gallon of gas in the U.S. is $3.58.
  • California ($5.10), Hawaii ($4.78), and Washington ($4.55) have the highest average prices for a gallon of gas in the U.S.
  • Mississippi ($3.03), Arkansas ($3.07), and Oklahoma ($3.08) have the lowest average prices for a gallon of gas in the U.S.

American Gas Spending

  • On average, Americans spend $1,712 annually on gas.
    • Americans reported spending an average of $3.76 per gallon of gas.
  • On average, Americans are spending roughly 3% of their annual income on gas.
  • On average, Americans believe that a gallon of gas should cost $2.37 per gallon, roughly 37% less than what they are currently paying.
  • 23% of Americans are holding back on summer travel and/or road trips due to gas prices.
    • Millennials are the most likely to hold back (24%).


When choosing which gas station to fill up at:

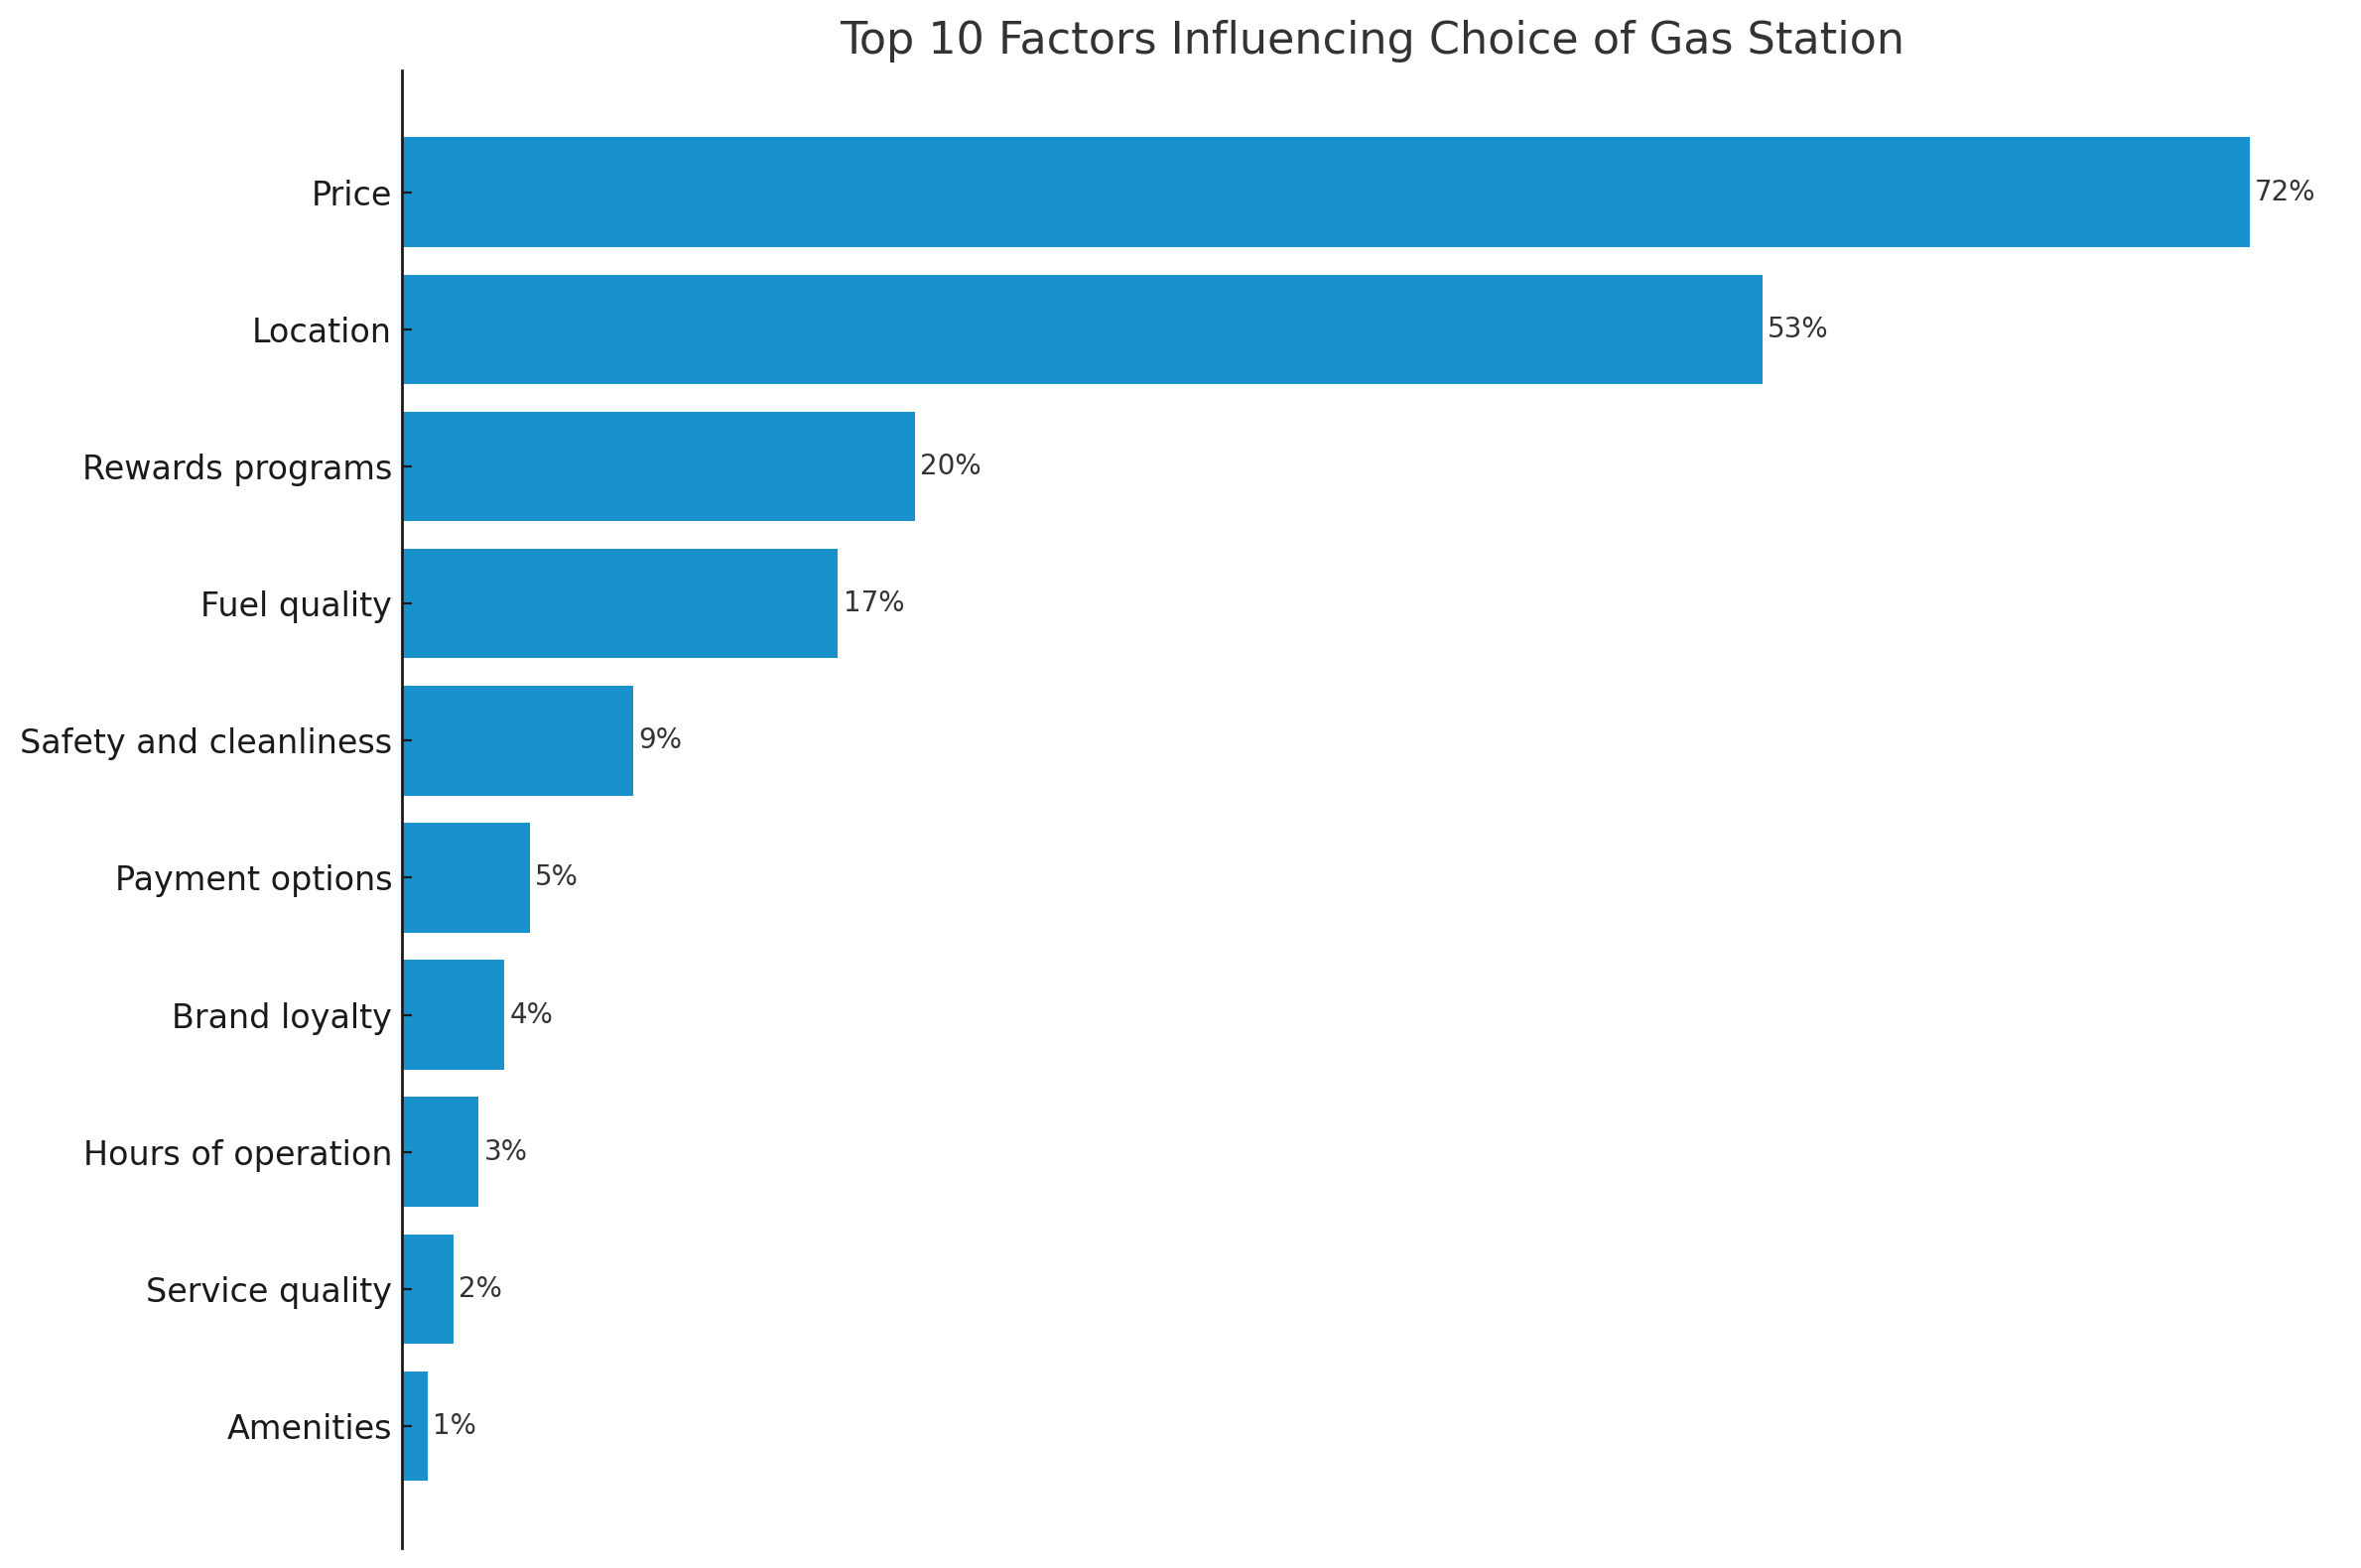
  • Gen Z is the most likely generation to be influenced by price (78%).
  • Millennials are the most likely generation to be influenced by location (54%).
  • Gen X is the most likely generation to be influenced by fuel quality (21%).


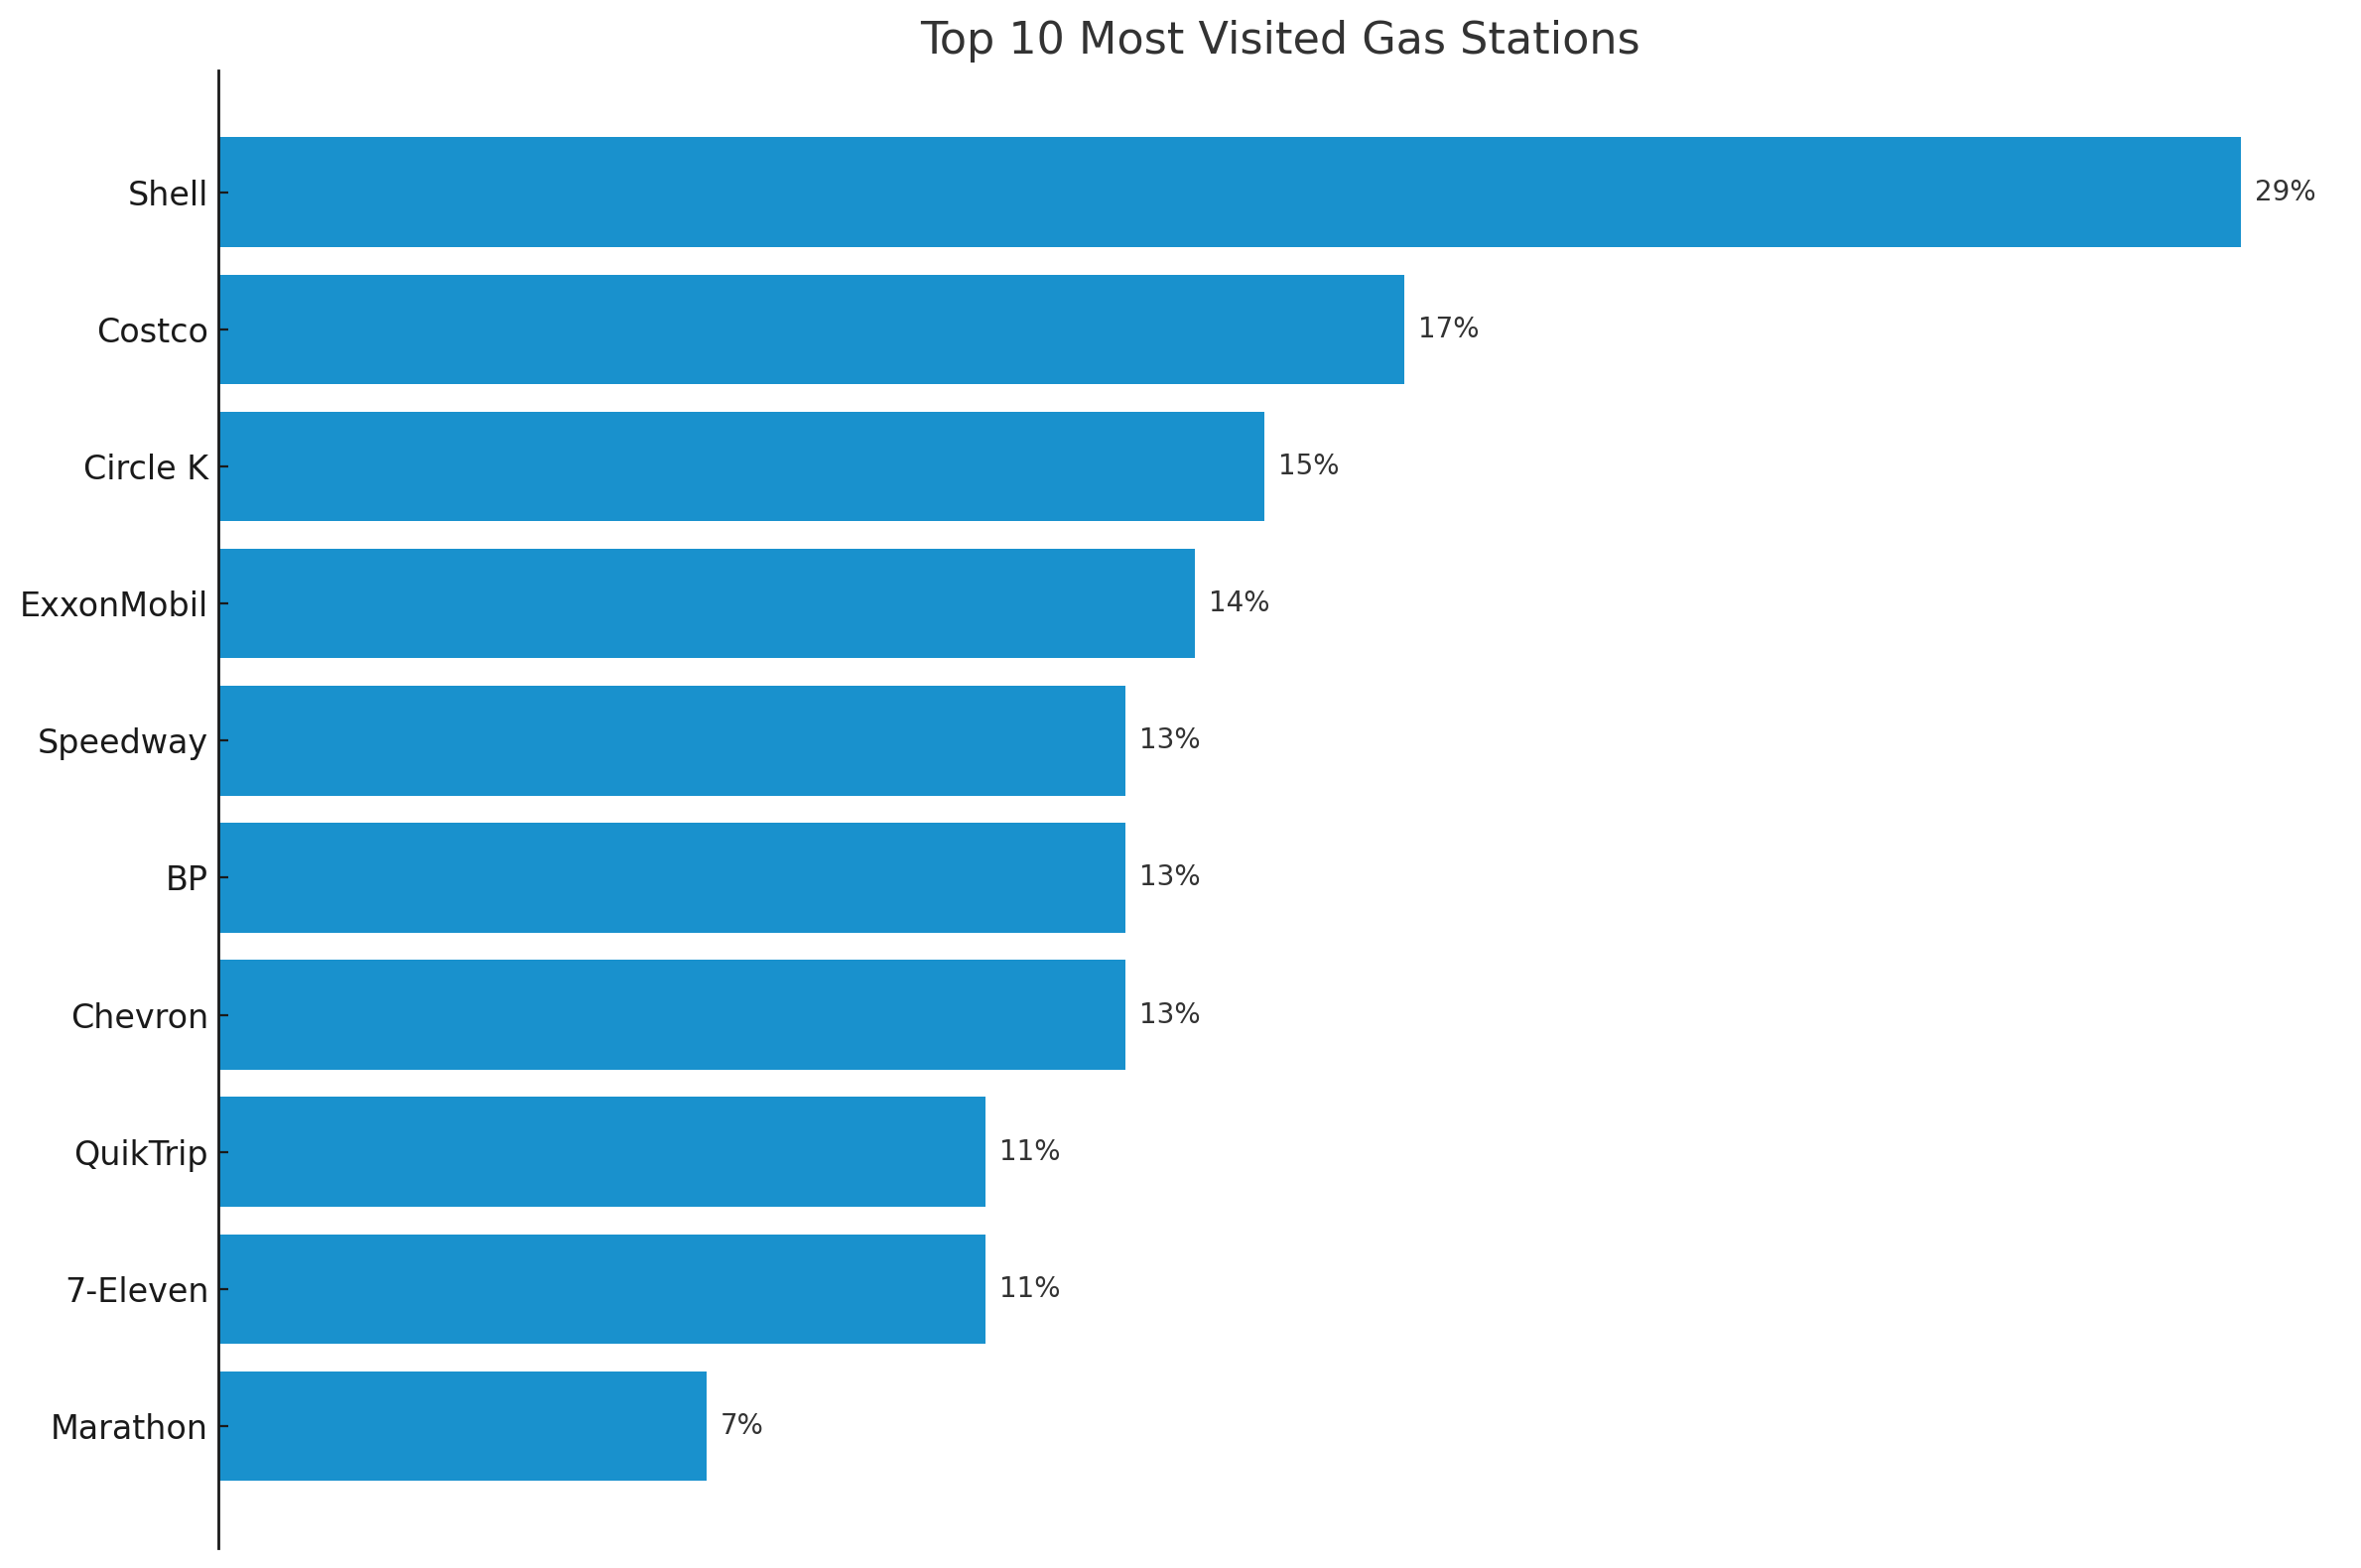
  • Gen Z and millennials are the most likely to visit Shell (32%) for gas compared to other generations.
  • Gen Z is the most likely to visit Costco (22%) for gas compared to other generations.

July 4th Travel

  • Even with the slight gas price decrease over the last year, 25% of Americans are  planning to travel less than they had on previous July 4th weekends; 68% plan to travel the same amount and 7% plan to travel more.
    • Baby boomers are the most likely to plan less travel compared to previous years (29%).
    • Gen Z are the most likely to plan more travel compared to previous years (18%).
  • 38% of Americans say extreme heat and weather predictions negatively impacted their travel plans this year.
    • Gen Z is the most likely to say so (51%).
  • Still, 46% of Americans plan to travel this year for July 4th. Gen Z is the most likely to do so (61%).
    • 42% of Americans plan to travel by car.
    • 4% plan to travel by plane.
    • 1% plan to travel by other means.
  • Top reasons Americans plan to travel by car this July 4th weekend:
    • Travel distance (62%)
    • Flight prices (34%)
    • Slight decrease in gas prices (17%)
  • Top reasons Americans plan to travel by plane this July 4th weekend:
    • Travel distance (78%)
    • High gas prices (42%)
    • Extreme heat (36%)

Methodology

For this study, we leveraged AAA resources to gather prices of regular gasoline in every state on May 29, 2024. Note that gas prices are subject to change.

We surveyed 1,006 Americans who own a car about their gas-filling habits and sentiments. Of the respondents, 50% identified as millennials, 29% as Gen X, 11% as baby boomers, and 10% as Gen Z.

We surveyed an additional 1,005 Americans who own a car about their July 4th travel plans. Of these respondents, 47% identified as Gen X, 42% identified as millennials, 6% identified as baby boomers, and 5% identified as Gen Z.

About American Trucks

At American Trucks, we’re dedicated to building a community for truck owners, offering the tools and resources to improve their driving experience. We provide top-quality parts, accessories, and expert advice, making us the go-to source for all your truck-related needs.

Fair Use Statement

Feel free to use these findings in your noncommercial projects. Please cite our work with a hyperlink.